

As a business owner, you are always looking for ways to streamline tasks and processes. When it comes to finding the statistics you need in Google Analytics, the process can be an arduous one. In my previous blog post about Google Analytics for your fashion business, I mentioned the importance of creating a Custom Dashboard inside your Analytics’ profile to shave valuable time off of your data gathering process.
A Custom Dashboard is a unique feature of Analytics that allows a user to customize the data they want to view. The Dashboard saves and automatically pulls in your data, so you only have to click once, set your date range, and then never have to wonder where to find your metrics again.
Determine Your Data
Before you set up the Dashboard, you’ll be able to complete the process much faster if you know precisely the type of data you need to track.
There are many pieces of data in Google Analytics that may not be relevant to your specific website. For example, if you manage an e-commerce website, knowing the top landing pages on your website will be helpful to keep track of popular products. If, however, your website is only a landing page or an information-based site, consider tracking time on site and goal completions.
Take a moment to write down the goals for your site – what you are looking to accomplish with the website – and then select some of the top pieces of information you want to track. Use that data to create your Custom Dashboard.
Here are ideas of specific statistics for your Dashboard:
- Top locations of your audience
- Top exit pages
- Average page load time
- Total Sessions
- Bounce Rate
- New vs. Returning Users
- Mobile vs. Desktop Sessions
Set Up the Dashboard
There are two ways to set up a Dashboard, you can download a template dashboard from a number of online resources or you can create your own Custom Dashboard.
I prefer to set up my own Dashboard instead of using a template, so I can think through how best to arrange, display, and track the data for my website. However, if you find a template that works for your website it may save you a few steps to go that route.
We’ll go ahead and walk through the process of creating your own Dashboard. The process is simple but can also be time-consuming if you’re unsure where to start.
Phase One: Creating and Naming
The first step is to know where the Dashboard is located:
- Open your Google Analytics profile
- On the left panel select Customization
- Under Customization choose Dashboard and then Create
- Under Create select Blank Canvas and remember to title your Dashboard
Next, you will automatically be led to create a Widget. For each piece of data you want to start tracking in your Custom Dashboard, you’ll need to create a unique widget.
Phase Two: Adding Widgets and Data
Here’s how to add a widget to your Dashboard. Inside your Dashboard, there are six different widgets options:
- Metric – displays a single number with or without decimals
- Timeline – uses a line graph to demonstrate how data changes over time.
- Geomap – shows a map of the world shaded blue for where your top users are located
- Table – a simple table that can have up to 2 columns and 10 rows of data
- Pie – a pie chart widget to compare and contrast data
- Bar – displays a traditional bar graph that can show up to 9 bars
We’ll start with adding a Session (metric widget) and then we’ll talk through how to add New vs. Returning Users (pie widget).
- Title your first widget “Sessions”
- Select 2.1 Metric
- Under the heading ‘Show the Following Metric’ find Sessions in the drop down
- Your widget creator should look like the following:
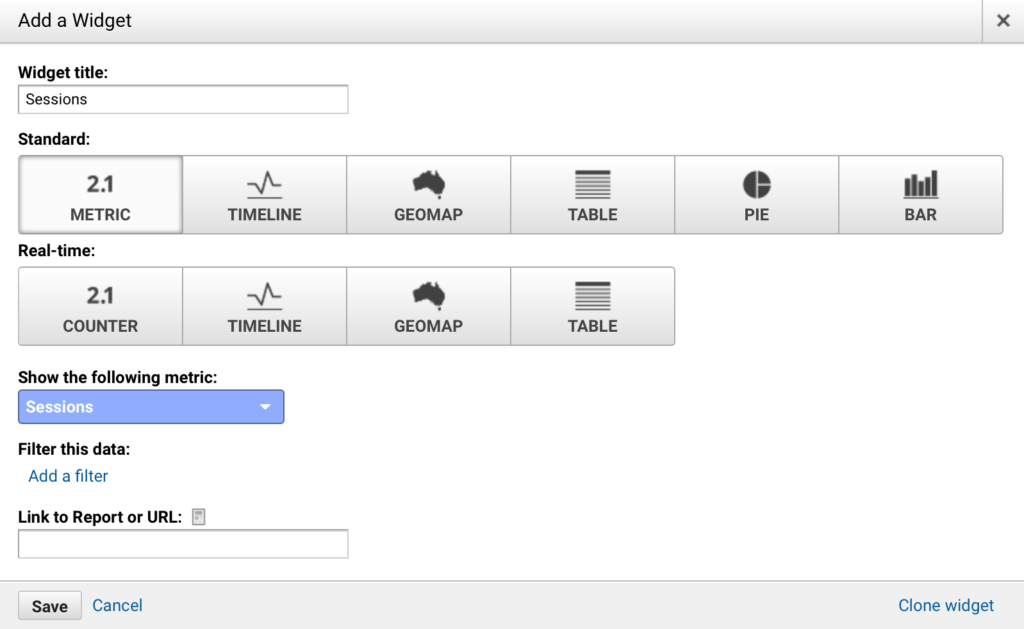
- Click save and now you’ll be returned to your Dashboard with the Sessions widget ready to go
Adding Metric widgets is simple because there’s no need for comparing or contrasting different pieces of data. Some of the best statistics displayed as Metrics include Sessions, Pageviews, Bounce Rate, Average Time per Session, and Average Pages per Session.
Set these metrics up on your Custom Dashboard all with just a few simple clicks and you’ll be on your way to saving time.
Setting Up A Pie Widget
A second popular type of displayed data is in the form of a pie chart, or as referenced in the Dashboard, Pie. Most data analyzers use pie charts to show New versus Returning Users as well as Mobile versus Tablet versus Desktop users.
It’s an easy way to show the comparison among the different types of users on your website.
Setting up a Pie widget is not much more difficult than a Metric widget, it just takes knowing where and what to click. Follow the steps below to set up your New versus Returning User widget:
- Select Add Widget at the top of your Dashboard
- Title your widget New vs. Returning Users
- Select Pie
- In the “Add a metric” drop-down select Sessions
- In the “Add a dimension” drop-down select User Type
- Click save
And you’re done!
Work through those same steps for any additional Pie widgets you want to create, making sure to remember that the Metric drop-down should be set to Sessions and the dimension drop-down should indicate what type of data you want to reveal.
The Next Steps
Each Analytics view can contain up to 20 Custom Dashboards with multiple pieces of data, each with the ability to share and export the Dashboard. With this feature, you can quickly create multiple Dashboards and share them with your team so they can be kept up to speed with the impact their work is having on the website.
The Custom Dashboard feature inside Google Analytics allows you to create shortcuts to the most valuable data you need to track on your website. Although the process may be time- consuming at first, it will save you valuable time every month as you track your data and the success of your website.